

The S&P 500 dropped 1.02% to 6,810 on March 3, 2026, as the US-Iran conflict extended and Brent crude briefly surged toward $85. The head and shoulders breakdown flagged last week played out, with the key US stock market index breaching the 6,770 neckline.
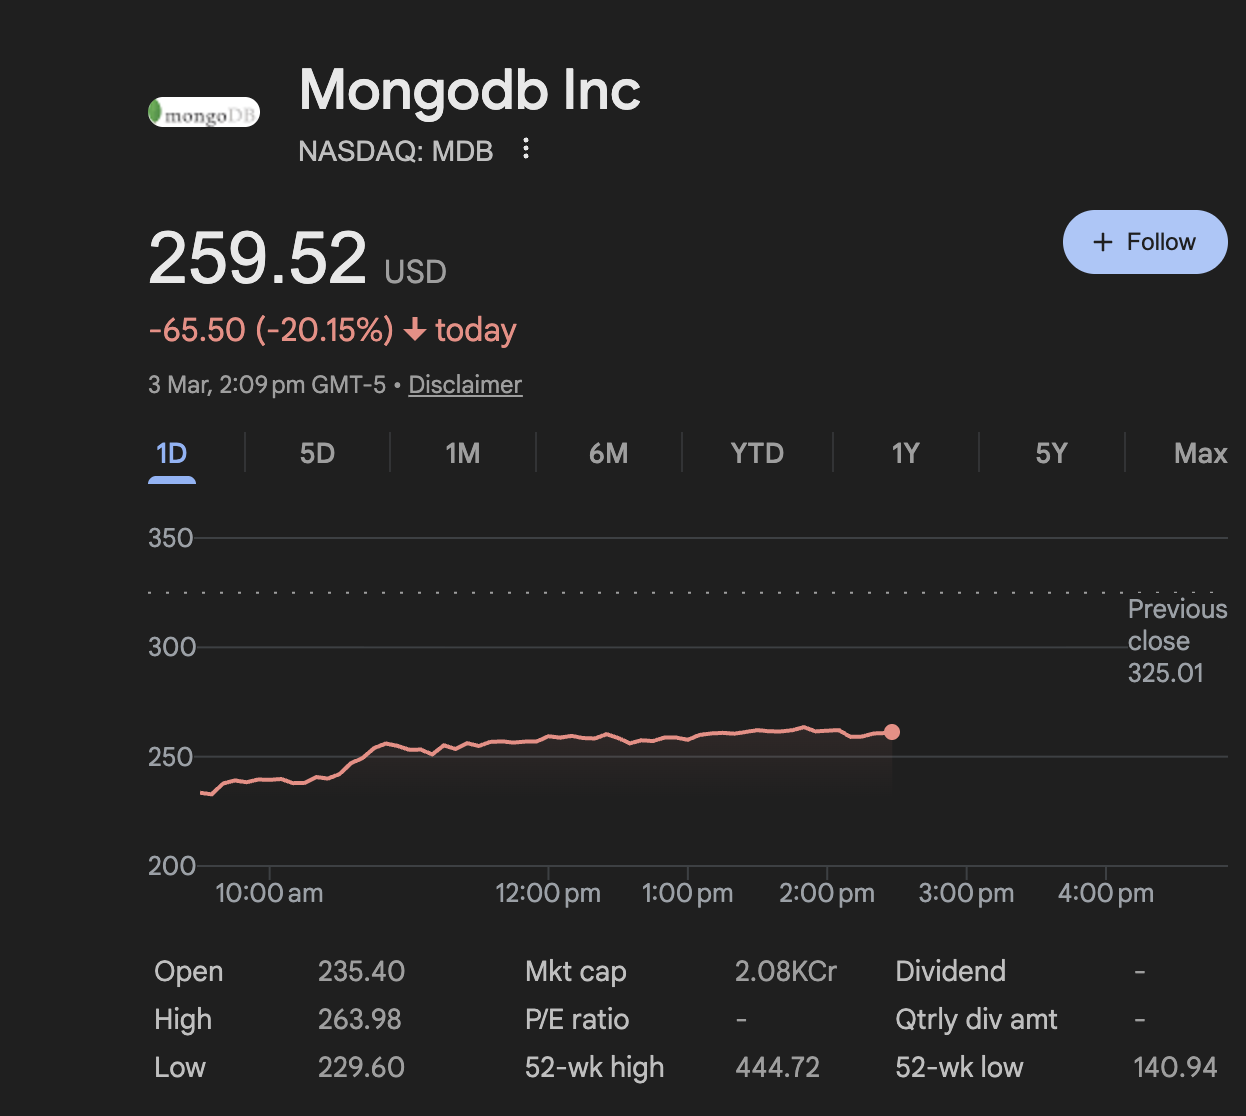
Communication Services (XLC) held ground as the most resilient sector, while Basic Materials (XLB) bled the hardest. MongoDB (MDB) crashed 20% on slowing growth guidance.
Top US Stock Market News:
- Oil Spikes As Iraq Shuts Rumaila Field, War Enters Day 4: Brent crude briefly surged toward $85 before pulling back to around $81 at press time, as Iraq shut down production at Rumaila — the world’s second-largest oil field producing 1.5 million barrels per day — amid escalating military activity.
The Strait of Hormuz has remained effectively closed since the weekend, with major shippers suspending transits. Rising energy costs compound inflation fears, with traders now pricing in fewer than two Fed rate cuts for 2026 ahead of the March 17-18 FOMC meeting.
- Global Markets Post Largest Declines In Months — South Korea Down 8%, Germany Down 5% at press time: The selloff is global and synchronized. South Korea crashed 8%, Japan fell 6%, South Africa and Germany both dropped 5-6%, while the Nasdaq 100 and China each shed 2%.
Monday’s dip-buy recovery now looks like a false signal — the market is beginning to price in a longer war. Trump added to the pressure by cutting off all trade with Spain after Madrid banned the US from using its military bases for strikes on Iran.
- Gold Retreats To $5,100, Silver Slides Under $83 As Profit-Taking Kicks In: Gold pulled back sharply to around $5,100 after touching $5,400 on Monday, while silver slipped below $83.
The correction is possibly due to profit-taking after a multi-day rally and DXY strengthening as Brent surges— not a shift in the fundamental safe-haven thesis. The longer the conflict persists, the stronger the floor under precious metals. Bitcoin, at above $68,000, is holding better than its October-to-February decline would suggest, but remains firmly a risk asset in this environment.
74% of Wall Street Is Falling, But Bulls Haven’t Flinched
The US stock market is selling off on March 3, 2026, as the Iran conflict extends and oil prices spike — but the damage isn’t where you’d expect.
At press time, 73.6% of stocks are declining while the Bull/Bear gauge reads 64% bull — significantly more optimistic than February 27’s PPI shock, when only 64% of stocks were red, but the gauge sat at 55% bull. The S&P 500 is down 1.02% to 6,810, the Nasdaq is off 1.08%, the Dow is down 0.96%, and the Russell 2000 is down 1.45%.
Here’s what’s unusual: breadth is far worse than the last selloff, but sentiment is actually more bullish. New lows are crushing new highs at 74.3% vs 25.7%, yet the market’s fear gauge has moved in the wrong direction. Fewer stocks were falling during the PPI shock, and bulls were more cautious at 55%.
Today, nearly three-quarters of Wall Street is red, and bulls are sitting at 64%. That kind of divergence: worse internals with rising optimism, is complacency, and it typically resolves with a sharper leg down once reality catches up.

The other tell: Russell 2000 is down less than February 27’s 1.76% drop despite a far more severe macro shock. Small caps should be getting crushed by oil-driven inflation and dollar strength, but they’re not leading the decline this time. The selling is concentrated in large caps — institutions are de-risking their biggest positions first, not panic-dumping across the board. When the smart money trims large caps while retail stays bullish, it’s worth paying attention.
S&P 500 Breaks Head And Shoulders Neckline — Bears Get Their Confirmation
The S&P 500 is trading above $6,810 at press time, down 0.88% from yesterday’s close. The head and shoulders breakdown we flagged last week has now played out. The index breached the 6,770 neckline, plunging to 6,710 before buyers stepped in. The measured move from that pattern projects a 3.29% decline toward 6,540. That target remains active.
The intraday bounce back above 6,770 shows fight in the bulls, but a tested and breached neckline typically becomes resistance on the next move down. Support sits at 6,770 and 6,710 (today’s low). Breaking those levels can push the S&P 500 to even 6,540.
Bulls need a daily close above 6,850, the 0.5 Fibonacci level, to weaken the pattern.

The VIX has surged 7.60% to 23.07, up 13.7% in three sessions since February 27’s reading of 20.28. A push above 25 shifts the market from nervous to panicked.

Unlike last week’s PPI shock, where yields fell on flight to safety demand, the 10-year Treasury yield is at 4.054%, barely changed. Bonds are not offering refuge because this is an inflation scare, not a growth scare.

The US Dollar Index up 0.70% to 99.074 confirms the chain reaction: oil surges, inflation expectations rise, the dollar strengthens, and equities, gold, and crypto all sell off from the same source.

Donald Trump stated that oil prices could drop lower than pre-war levels once the conflict ends, offering a potential relief valve.
But with the Strait of Hormuz effectively shut and fresh strikes still widening the conflict, that remains just a promise. The FOMC meets March 17-18, and every day of elevated oil between now and then tightens the Fed’s hand further.
Communication (XLC) Holds Ground As Basic Materials Take The Biggest Hit
Every US stock market sector is red on March 3, 2026, but the damage is uneven. The Materials Select Sector SPDR Fund (XLB) is the worst performer, down 4.8% at its lows. The Communication Services Select Sector SPDR Fund (XLC) is the most resilient, down just 0.38% on the day and up 0.67% on the week.

XLC’s strength has a clear technical base.
The ETF completed an inverse head and shoulders breakout on February 27. Despite the broader selloff, it is holding at $118, above the 0.786 Fibonacci level at $117. Lower wicks on recent candles show sellers pushed the price down, but buyers absorbed that pressure. A sustained hold above $118 opens the measured move toward $121.

XLB tells the opposite story. The ETF gapped down hard at the open as the US Dollar Index surged. A stronger dollar pressures commodity-priced materials directly because most global materials trade in dollars. When the dollar rises, those commodities become more expensive for foreign buyers.
But the candle turned green. Buyers stepped in at $50, and XLB recovered to $52. It is still trading inside its bull flag pattern, which is a continuation structure that follows a strong rally. The key support sits at $48. As long as that level holds, the broader structure remains intact.

A reclaim of $53 would revive the bullish case toward $56 and then $59. Until that happens, today looks more like a dollar-driven shakeout than a structural breakdown.
MongoDB Crashes 20% After Guidance Disappoints
MongoDB (MDB), the Nasdaq-listed database software company, is the biggest single stock casualty in the US stock market today. Shares are down 20% to $259.76. The company beat Q4 estimates with revenue of $695.1 million, up 27% year over year. But forward guidance signaled a sharp growth slowdown — FY2027 revenue of $2.86 billion–$2.90 billion implies just 16–18% growth, a steep deceleration from Q4’s 27% pace that triggered a rapid repricing.
The chart tells the rest. MongoDB had been trading inside a falling channel since late January. Today’s gap down broke the lower trendline. The stock plunged as low as $229.60, nearly 30% below the previous close, before recovering to $259.76. That low sits near the 0.786 Fibonacci level at $234.12.

The breakdown target aligns with the 1.0 Fibonacci extension at $205. First support sits at $256, followed by $234. Bulls need to reclaim $272 to gain strength. But with two senior sales leaders exiting and the broader stock market already punishing growth names, the path of least resistance for MDB remains lower.
The post Why Is the US Stock Market Down Today? appeared first on BeInCrypto.
from BeInCrypto https://ift.tt/3n46UWk


0 Comments